Creating a Dashboard
To create a new dashboard click on the "create dashboard" button on the main menu.
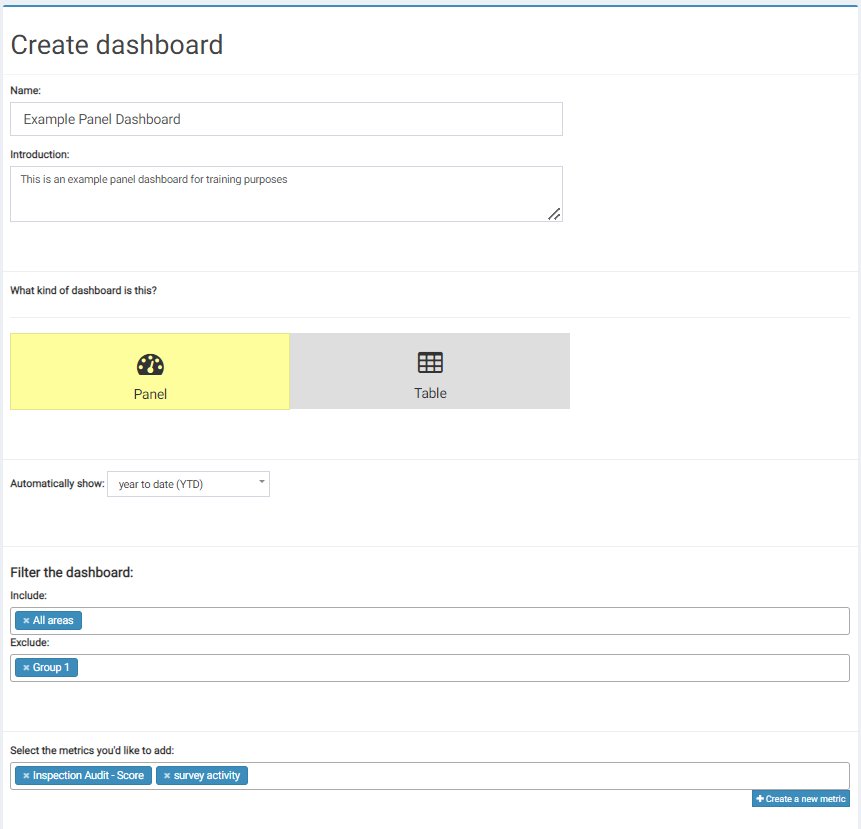
- First you need to name your dashboard, this is how your dashboard will be named on the system.
- Give an introduction to your dashboard. This will appear at the top of your dashboard and should summarize what your dashboard is representing.
- Decide on whether you would like to create a panel dashboard (visual charts) or a table dashboard (table layout). To see example of both of these and their benefits see viewing your dashboard.
- Select the time period that you would like your dashboard to show as default in the "automatically show" section. (When viewing the dashboard you can filter the dates for different views if you wish)
- Decide which areas of your organisation that you would like to include/exclude in the dashboard in the next step.
- Next, select the metrics that you would like to add to your dashboard from the dropdown list. If you have additional metrics that you would like to add that you havent yet created you can do this here with the "create a new metric" button. More information on creating metrics can be found here.
Once you are happy with this section select save and you will be brought to a second window that is specific to whether you have chosen a panel or a table dasboard. This gives more options on how your chart/table will be presented in your dashboard.
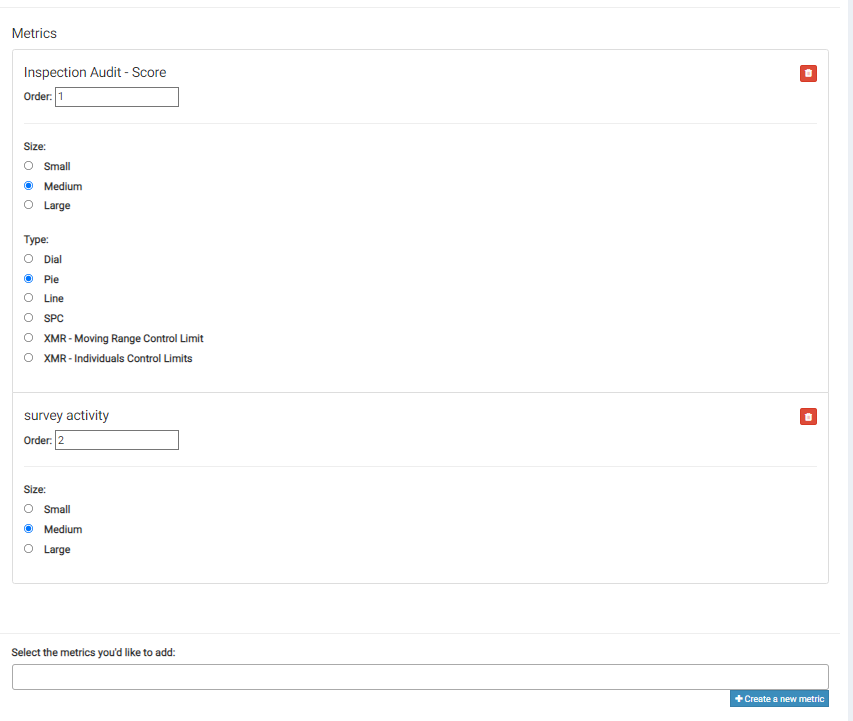
1. Panel Dashboard option:
Confirm the order of your metrics, the size of the text and the type of chart (dial, pie, line,etc.). You can also add additional metrics at this point if you wish.
2. Table Dashboard Option
Confirm the order of your metrics and whether or not you would like each metric to show "breakdown" and "indicators". Show breakdown= show the numerator and denominator for this metric. Show indicator = showing an arrow if the data is going up or down. You can also add additional metrics at this point if you wish.
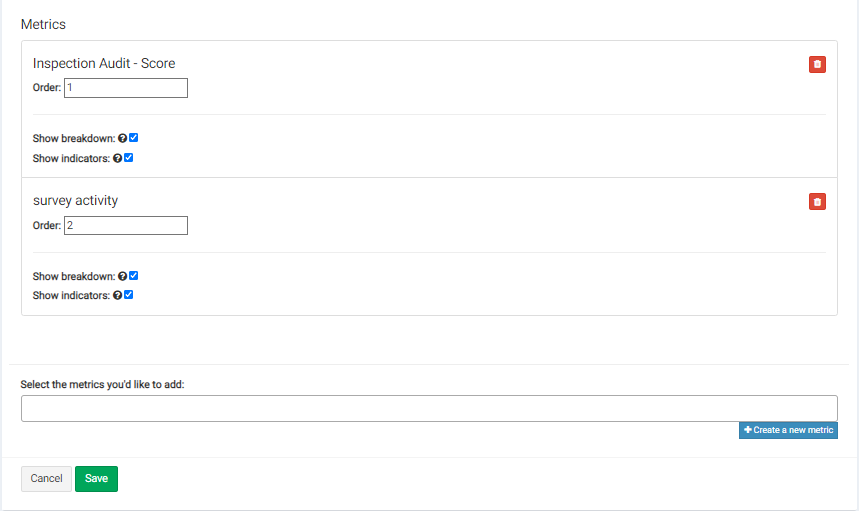
Press the save button and you can view your new dashboard.