Dashboards, Metrics and Targets
Dashboards combine information from more than one project in a single space, where Reports illustrate data from one individual project.
In this section we are going to go through an overview of what dashboards are and how they are driven by metrics and targets as a high-level concept.
Dashboards are very powerful tools for illustrating the key information that is important to you, from multiple projects across your organisation.
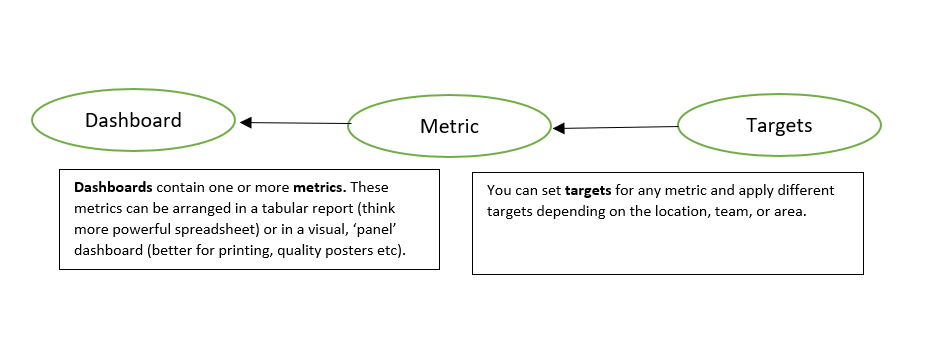
All dashboards are driven by metrics.
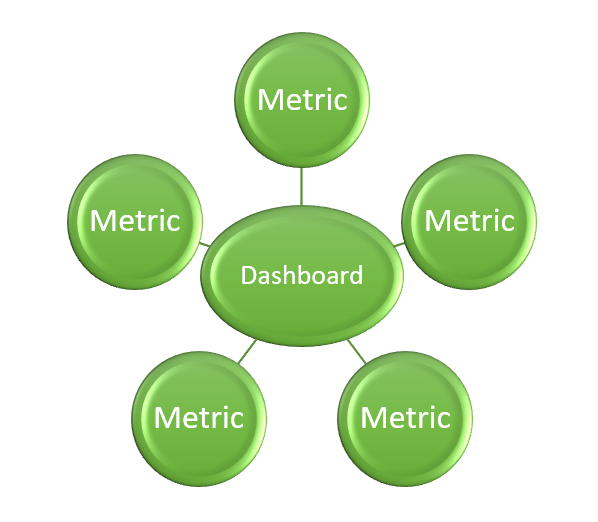
A metric can be a Project, Tag or Preset.
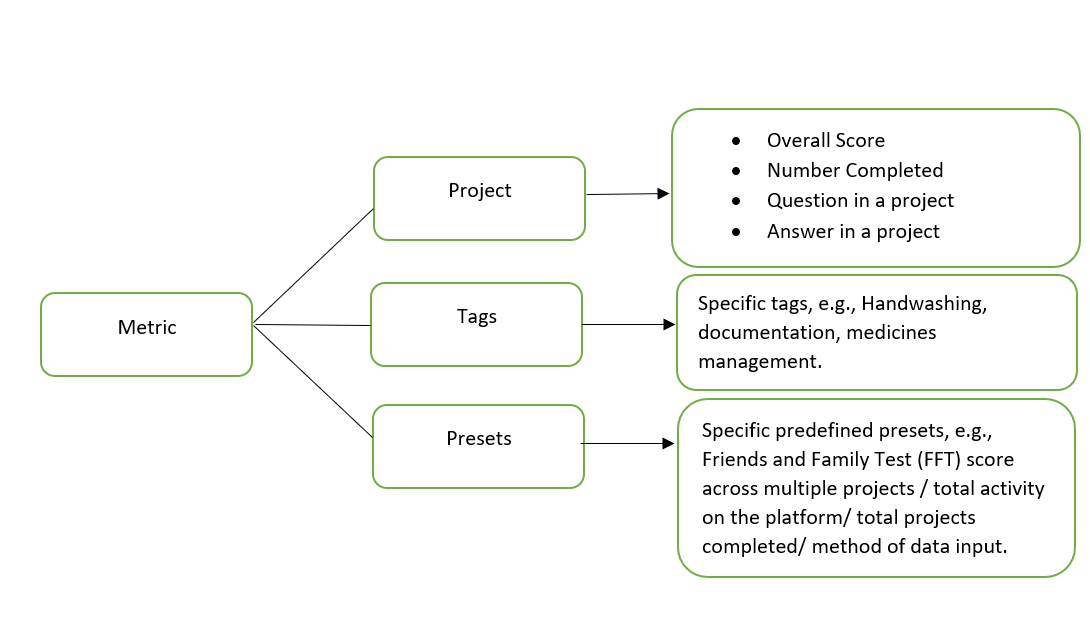
- Examples of using projects as metrics include: the overall score of a project, the number of projects completed, a specific question in a project, a specific answer in a project.
- Examples of using tags as metrics include tags such as "handwashing documentation", "medicines management", etc.
- Examples of using presets as metrics include predefined presets such as Friends and Family Test scores across multiple projects, total activity on the platform (for example on tablets), total projects completed and the method of data input (eg. through a tablet/mobile/desktop)
It is also useful to give your metrics targets. This allows you to immediately see whether the results on your dashboard are positive, negative or neutral based on your own set definitions. You can set targets for any metric and apply different targets depending on the location, team or area.
The first step to creating your dashboard is to create a metric