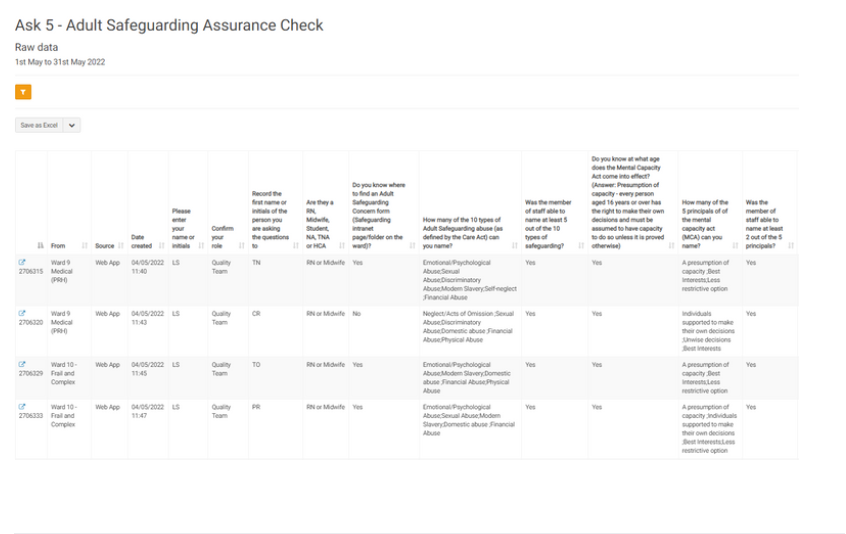
Raw Data Chart
This section gives you line by line responses to each project to allow for further analysis and filtering.

You can choose the "show score" layout which shows the weighted results of the answers (quantitative) rather than the comments themselves (qualitative).
Clicking on any record will bring you back to the project/survey itself with the responses highlighted in red or green depending on the overall average sentiment of the responses.
You can also export and save the raw data through the "save as" button.
